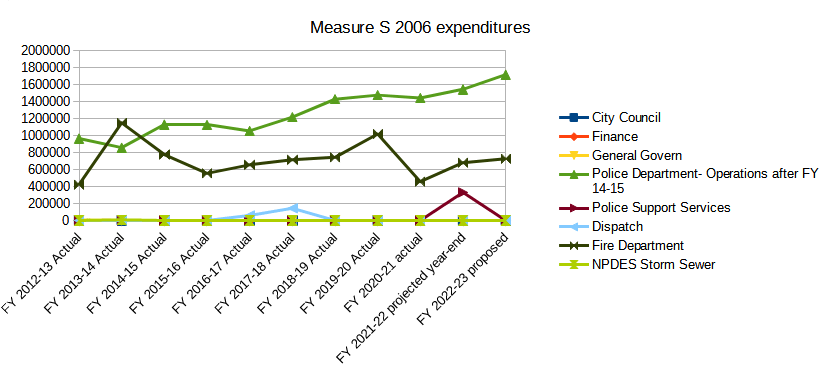
Measure S 2006 funds have been mostly spent on Police and Fire services, with the amount spent on Police tending to increase steadily over time while Fire is more variable. This data goes back to FY2012-2013 actuals, as I have concerns about the reliability of data from years prior that I have not been able to resolve.
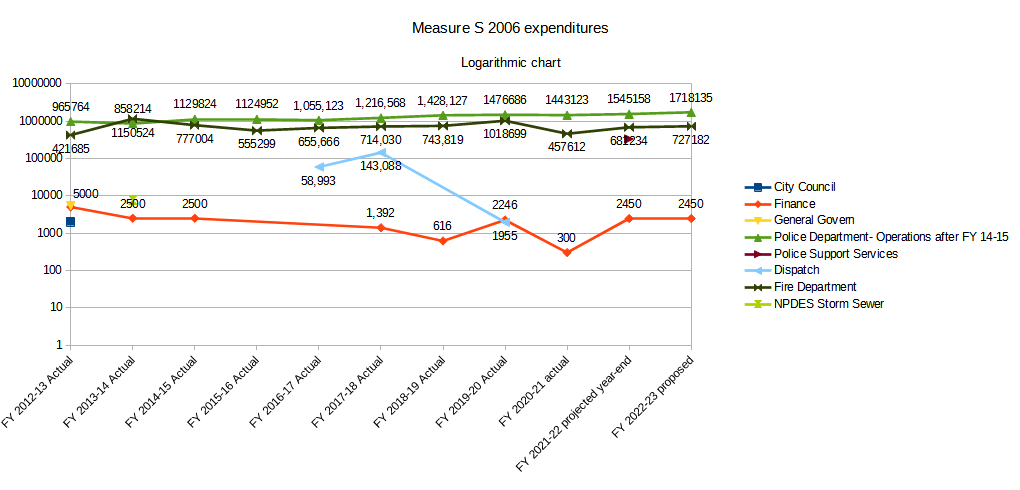
To show the expenditures for lower values more clearly, there is a logarithmic chart where each increase on the Y-axis marks an order of magnitude increase in the amount tracked. It allows for reviewing trends in all the categories without having the larger values for police and fire overwhelm the others.
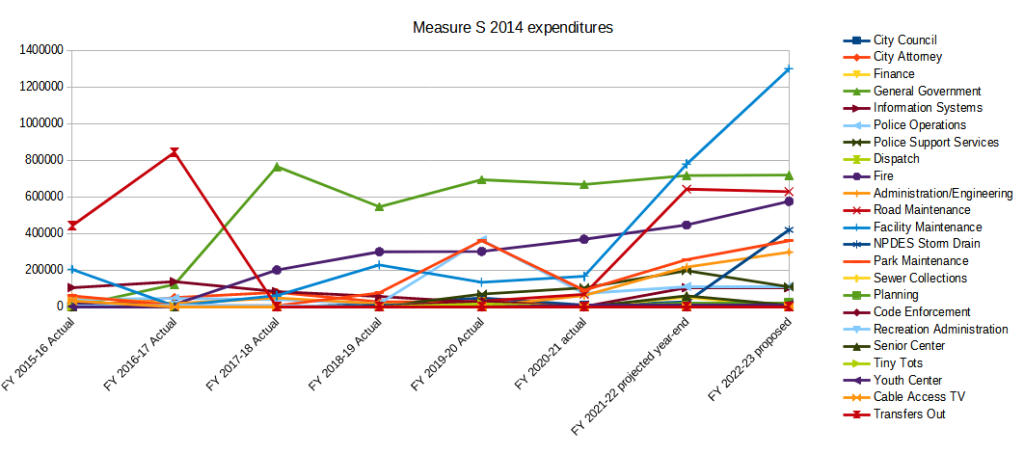
Measure S 2014 is *much* more complicated. Towards the beginning of the tax history, we can see a substantial chunk of funds moved to transfers out, which ends after FY 16-17. We see facility maintenance begin at a moderate level, decline, and then rise until FY 18-19, where it remains roughly stable until FY 20-21. After that it spikes to become the main expenditure category for FY 21-22 and especially FY 22-23. General Government starts off low, spikes to become the main expenditure category in FY 17-18, drops moderately in FY 18-19 and then roughly stabilizes from there between those points. Fire starts off low, but then gradually rises to become the fourth-largest expenditure category by FY 22-23. Park Maintenance has a spike in FY 19-20, drops off sharply in FY 20-21 and then starts rising again in FY 21-22 and FY 22-23. There’s a spike for Road Maintenance in FY 21-22 which is maintained in FY 22-23. And finally, NPDES storm drain expenditures rise markedly in FY 22-23.
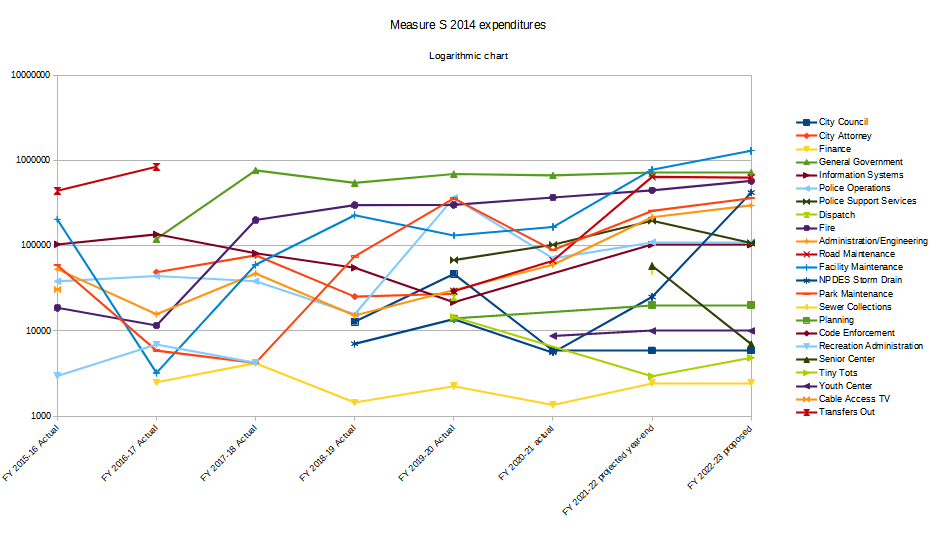
But quite a bit is hidden by the scale of the chart. Here again, the logarithmic chart can be helpful. It’s worth noting again that the amount of change within an order of magnitude is much greater for the higher Y-axis values- the difference between 100,000 and 1,000,000 is much greater than the difference between 1000 and 10,000. It shows us that sewer collection expenditures have remained constant, but relatively low. Recreation Administration expenditures were low, and stopped after FY 17-18. Cable Access TV had one, moderate expenditure in FY 15-16 and none afterwards. Tiny Tots started out a bit above low and declined to low, while Council rose to near-moderate before declining to low. The interesting points that couldn’t be seen in the main graph are the similar growth rates for Administration/Engineering and Park Maintenance after FY 20-21, a spike and decline in funds spent on Police Support Services from FY 19-20 through FY 22-23, leveling out of funds spent at the same level for Information Systems and Police Operations in FY 21-22 and FY 22-23 when they had very different trends prior to that, and the marked decline in expenditures on the Senior Center from FY 21-22 to FY 22-23.
Finally, you can see the raw tabular data behind the charts here. The relevant sheets are Sheet 2 and Sheet 3.
